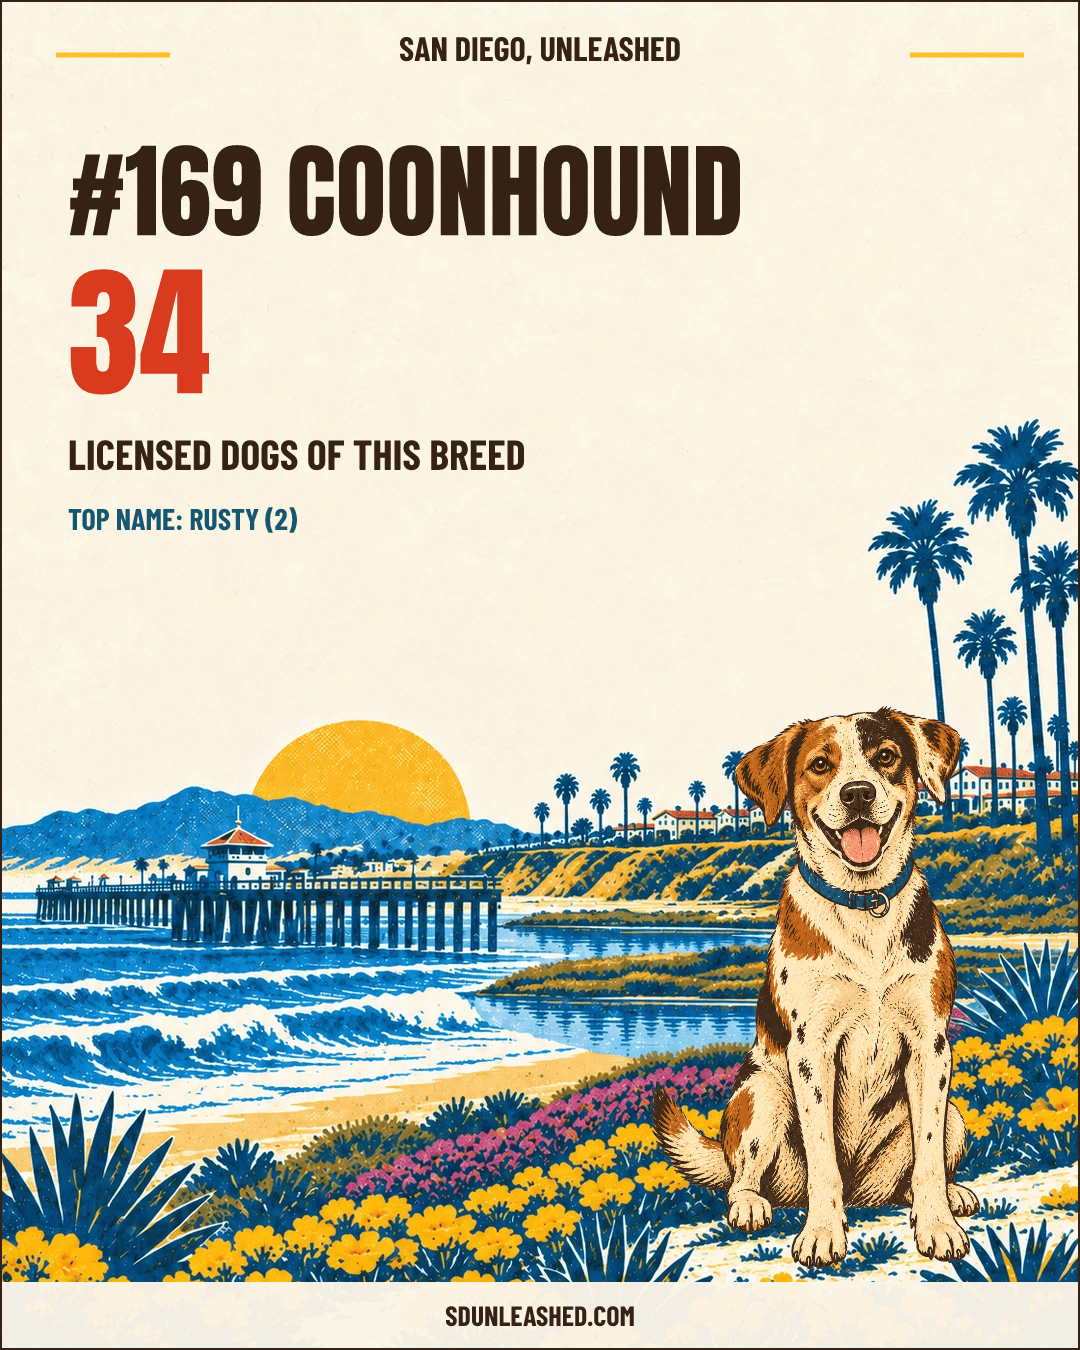
#169 Coonhound
34
licensed dogs of this breed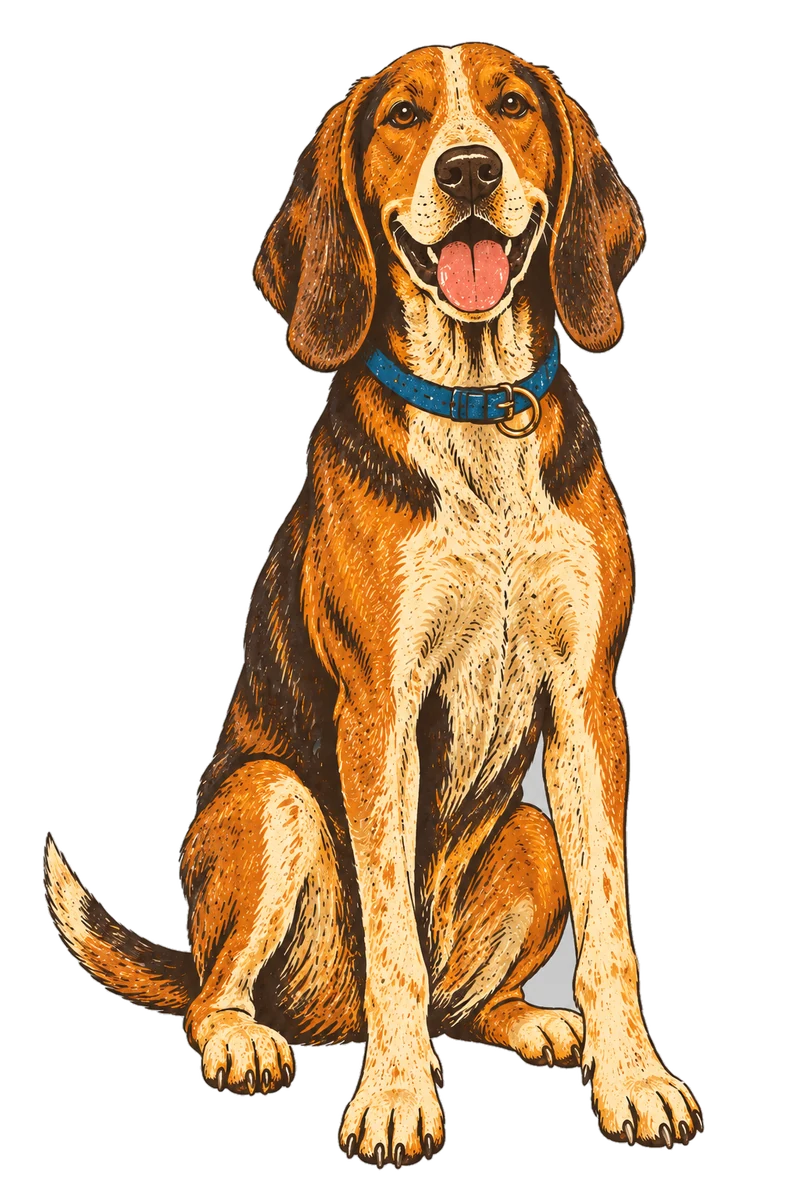
A closer look
Age, sex, neuter status, and the most common color combinations in these licensed-dog records.
Average age9.2 yearsOf 34 dogs.
Spayed or neutered100.0%34 altered · 0 not altered
Sex in the records58.8% male20 male · 14 female
Color combinations
Exact combinations are kept as reported. Color strips are visual guides, with the source wording shown beside each one.
Birth-year cohorts
The recorded birth years of licensed dogs in the Coonhound breed group. This describes dogs in the current snapshot, not historical popularity or licenses issued each year.
| Year | Licensed dogs |
|---|---|
| 1997 | 0 |
| 1998 | 0 |
| 1999 | 0 |
| 2000 | 0 |
| 2001 | 0 |
| 2002 | 0 |
| 2003 | 0 |
| 2004 | 0 |
| 2005 | 0 |
| 2006 | 0 |
| 2007 | 0 |
| 2008 | 0 |
| 2009 | 0 |
| 2010 | 1 |
| 2011 | 2 |
| 2012 | 1 |
| 2013 | 2 |
| 2014 | 6 |
| 2015 | 4 |
| 2016 | 1 |
| 2017 | 2 |
| 2018 | 6 |
| 2019 | 2 |
| 2020 | 3 |
| 2021 | 2 |
| 2022 | 1 |
| 2023 | 1 |
| 2024 | 0 |
| 2025 | 0 |
| 2026 | 0 |
34 dogs are included in this chart.
The count, city by city
34 dogs, or 0.03% of the county’s licensed-dog records, are grouped under Coonhound. The rest have other breed groups.
| City | Licensed dogs | Share of city records |
|---|---|---|
| San Diego | 24 | 0.04% |
| Carlsbad | 2 | 0.03% |
| Encinitas | 2 | 0.05% |
| Oceanside | 2 | 0.02% |
| Escondido | 1 | 0.02% |
| Poway | 1 | 0.03% |
| San Marcos | 1 | 0.03% |
| Santee | 1 | 0.03% |
| Chula Vista | City has no records in this data | — |
| Coronado | City has no records in this data | — |
| Del Mar | No Coonhound records in this data | — |
| El Cajon | No Coonhound records in this data | — |
| Imperial Beach | No Coonhound records in this data | — |
| La Mesa | No Coonhound records in this data | — |
| Lemon Grove | City has no records in this data | — |
| National City | City has no records in this data | — |
| Solana Beach | No Coonhound records in this data | — |
| Vista | No Coonhound records in this data | — |